In July 2026, inflation in Italy fell to +2.8% on an annual basis, a slight slowdown compared to +3.0% in June, while the harmonized IPCA index stood at +2.9%. However, the picture is still marked by strong tensions on energy and transport, while the “shopping cart” shows a more contained dynamic.
This is confirmed by Istat’s preliminary estimates. But the July figure is still not fully affected by the fuel surge recorded in Italy, which only started in the second half of the month.
Slowing inflation
According to preliminary estimates, the national consumer price index for the entire community (NIC), including tobacco, records a monthly variation of +0.2% and a trend of +2.8%, down by two tenths compared to the previous month. The slowdown is mainly explained by the slowdown in prices of unprocessed food and unregulated energy.
At the same time, some components continue to push the overall index upwards, in particular processed foods and regulated energy products. Core inflation, net of energy and fresh food, remains stable at +1.6%.
Energy still protagonist
The most delicate chapter remains that of energy, which records significant increases:
- the price of regulated energy accelerates from +9.2% to +14.9% on an annual basis;
- the price of unregulated energy slows from +13.3% to +10.6%.
The cause of these increases and decreases is mainly due to the divergent trend between protected tariffs and the free market, in addition to the volatility of fuels.
Stable shopping cart
On the food front, the picture is more nuanced. Unprocessed food prices slowed from +4.4% to +3.8%. The decline is mainly due to the decline in fruit and nuts, as well as the slowdown in vegetables and legumes. Processed foods, on the other hand, return to positive territory with an annual variation of +0.2%, after -0.2% in June.
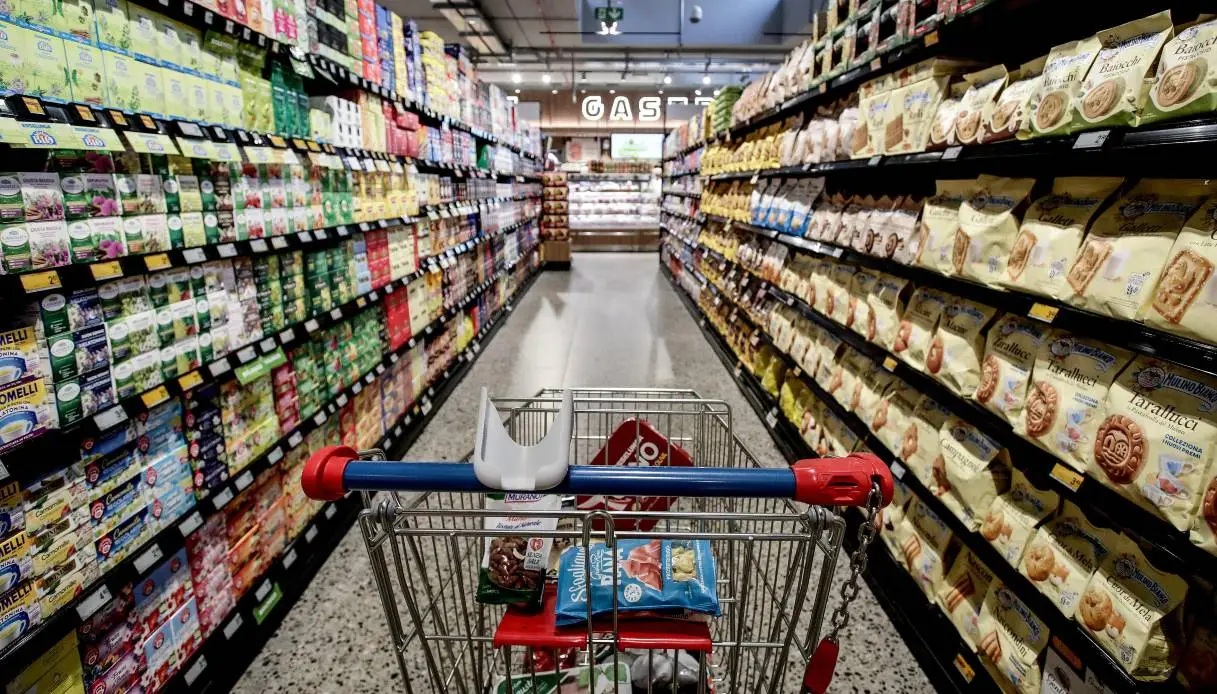
The so-called shopping cart, i.e. the index of food, home and personal care goods, remains stuck at +1.3% on an annual basis.
For Italians the expense is +926 euros per year
On the inflation front, the glass is still half empty, because the July figure is not fully affected by the fuel surge recorded in Italy, which only started in the second half of the month. This was stated by Codacons, commenting on the data provided today by Istat.
Inflation at 2.8% translates, considering the totality of consumer spending, into an increased expense of 926 euros per year for the “typical” family, +1.279 euros for a household with two children. In addition to the unrecorded figure for petrol, the real blow at the moment is the one that has hit electricity and gas tariffs. Observe the Codacons:
in fact, in July gas prices on the protected market soared by +22.1% compared to last year, rising in just one month by +8.8%, while electricity recorded a +9.7% year-on-year. On the free market, gas increases on an annual basis by +7.4%, while electricity rises by +10.4%.
Unc: “data underestimates fuel escalation”
However, the comment by Massimiliano Dona, president of the National Consumers Union, is more weighty, considering the drop from 3% to 2.8% “an optical illusion”. In any case, the setback remains for families: for a couple with two children, considering the trend inflation of 2.8% there is an overall increase in the cost of living of 1008 euros on an annual basis. For a couple with 1 child, the total additional annual expense is 933 euros.
Below, here is a table with the annual increases by family type and expenditure divisions (values in euros) on trend inflation in May, based on Istat data processed by the UNC:
| EXPENDITURE DIVISIONS | Average family | Couple with 2 children | Couple with 1 child | Annual inflation for July |
|---|---|---|---|---|
| Food products and non-alcoholic drinks | 109 | 157 | 138 | +1.7 |
| Alcoholic drinks, tobacco and drugs | 13 | 16 | 18 | +2.5 |
| Clothing and footwear | 10 | 18 | 14 | +0.8 |
| Housing, water, electricity, gas and other fuels | 261 | 281 | 279 | +6.5 |
| Furnishings, appliances for domestic use and current home maintenance | 23 | 32 | 29 | +1.7 |
| Healthcare | 18 | 22 | 22 | +1.3 |
| Transport | 150 | 246 | 228 | +4.2 |
| Information and communication | 2 | 3 | 2 | +0.2 |
| Recreation, sport and culture | 11 | 19 | 16 | +0.9 |
| Education services | 3 | 10 | 6 | +1.6 |
| Restaurant services and accommodation services | 64 | 112 | 90 | +3.3 |
| Financial and insurance services | 17 | 25 | 23 | +1.9 |
| Personal assistance, social protection and various goods and services | 51 | 67 | 69 | +3.2 |
| TOTAL ANNUAL PRICE INCREASE | 732 | 1008 | 933 | +2.8 |
| SHOPPING CART | +119 | +171 | +151 | +1.3 |