Inflation accelerates in Italy and goes from 3.3% in August to 4.2% in September 2026. This is confirmed by Istat, with the survey relating to the definitive data on consumer prices.
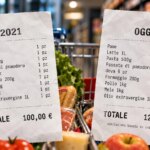
The cyclical variation is equal to +0.7%. Above all, the increase in energy and fresh food costs weighs heavily. The increase also concerns the shopping cart in general, whose annual growth goes from 0.9% to 1.5%.
Inflation is increasing in Italy
Going into specifics, regulated energy goods went from +18.6% to +25.8%, while unregulated ones went from +17% to +22.5%.
Core inflation rose to +1.6% (from +1.5%) and the average annual change, acquired in September, to +3.1%. Underlying inflation refers to a measure of consumer prices that excludes the most volatile components, namely energy and unprocessed food. This is the state of inflation net of energy goods alone: from +1.7% to +2%.
The inflation acquired for 2026 is equal to +3.1% for the general index and +1.9% for the underlying component.
As regards inflation as a whole, the preliminary estimate is thus confirmed.
The energy
Prices, in general, are driven by the new acceleration in the prices of energy goods. In fact, when energy increases, it costs more to produce goods and also to distribute them. And companies have less money to invest in innovation and people. And, as a result, entire sectors see prices increase.
Services, goods and transport
The prices of recreational, cultural and personal care services also increased (from +2.6% to +2.9%), while transport also recorded more sustained growth on an annual basis (from +0.8% to +1.6%).
The growth in prices of goods went from +4.1% to +5.4%. It therefore exceeds the growth in prices relating to services (from +2.4% to +2.6%). The differential between the sector thus goes from -1.7 to -2.8 percentage points.
This is the trend in prices of food, home and personal care goods: from +0.9% to +1.5%. And here the trend of high purchase frequency products is shown: from +4.3% to +5.2%.
Below is the trend of the Nic consumer price indices by expenditure division in September 2026 (Nic stands for the national consumer price index for the entire community):
| Spending Division | Inflation (%) |
|---|---|
| Food products and non-alcoholic drinks | +2.1 |
| Alcoholic drinks and tobacco | +2.5 |
| Clothing and footwear | +0.8 |
| Housing, water, electricity, gas and other fuels | +6.2 |
| Furnishings, appliances for domestic use and current home maintenance | +1.8 |
| Healthcare | +1.1 |
| Transport | +4.8 |
| Information and communication | -0.2 |
| Recreation, sport and culture | +1.3 |
| Education services | +1.4 |
| Catering services and accommodation services | +4.2 |
| Financial and insurance services | +2.9 |
| Personal assistance, social protection and various goods and services | +3.1 |
| General index | +3.1 |
As highlighted, everything increases with one exception: that which concerns information and communication services (-0.2%). It is possible to hypothesize that, faced with the increase in the cost of living, families and businesses pay more attention to these expenses even if the price data alone do not allow us to establish whether demand has actually decreased.
The burden on families
And what about families? In the third quarter of 2026, the price increase measured by the harmonized HICP index was higher for households with lower spending levels (+4.4%) than for those with higher spending levels (+2.9%). Translation: those who were bad are now even worse.
Finally, remember that in the last 25 years prices have increased by up to +120%.